Mason Creek Weather Dashboard
Summer Edition Dusk 08:56:52 PM
Mason Creek Weather Dashboard
Summer Edition Dusk 08:56:52 PM
|
Mason Creek Weather Dashboard
Summer Edition Dusk 08:56:52 PM
|
| Links → W5SDC Radio Gauge Dashboard Graph Dashboard LCD Display Local Forecast
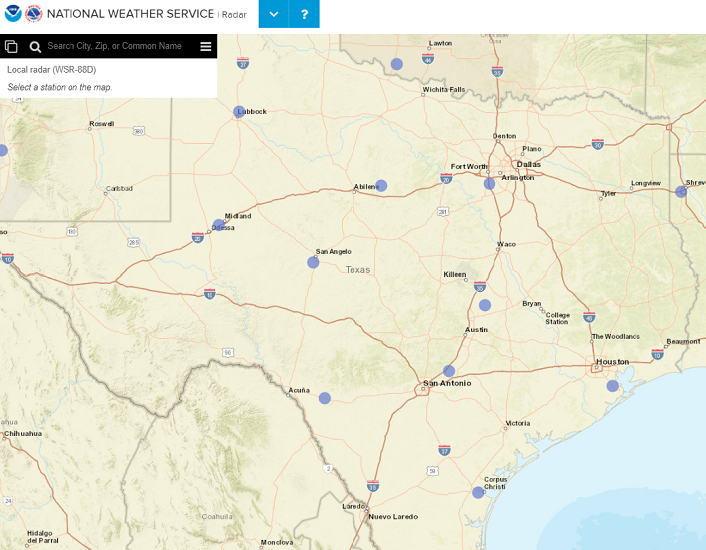
Texas Temperature Map
Hazardous Weather Outlook National Hurricane Center |
clock widget courtesy of 24timezones.com Time Server: time.nist.gov
|
| High/Low Temp |
96°F 12:53 PM 74°F 07:00 AM |
|
Feels Temp Hi Feels Temp Lo |
105°F 12:46 PM
79°F 06:57 AM |
|
High/Low/Avg Humidity |
98% 06:26 AM 52% 01:09 PM 82% Average |
|
High/Low Dew Point |
78°F 09:53 AM 72°F 12:27 AM |
| High/Low Pressure |
30.074 in 07:35 AM 30.010 in 01:13 PM |
| Highest Wind Gust | 11 mph 09:00 AM |
| Rainfall | 0.00 in |
| High/Low Temp |
96°F Jul 26 74°F Jul 26 |
|
Feels Temp Hi Feels Temp Lo |
105°F Jul 26
79°F Jul 26 |
|
High/Low Humidity |
98% Jul 26 52% Jul 26 |
|
High/Low Dew Point |
78°F Jul 26 72°F Jul 26 |
| High/Low Pressure |
30.074 in Jul 26 30.010 in Jul 26 |
| Highest Wind Gust | 11 mph Jul 26 |
| Rainfall | 0.00 in |
| High/Low Temp |
107°F Jul 22 70°F Jul 15 |
Feels Temp Hi Feels Temp Lo |
119°F Jul 22
72°F Jul 15
High/Low Humidity |
99% Jul 03 |
38% Jul 21
High/Low Dew Point |
81°F Jul 11 |
67°F Jul 06
High/Low Pressure
|
30.145 in Jul 15 |
29.789 in Jul 22
Highest Wind Gust
|
23 mph Jul 16
|
Rainfall
|
4.07 in
|
|
| High/Low Temp |
107°F Jul 22 16°F Jan 26 |
|
Feels Temp Hi Feels Temp Lo |
119°F Jul 22
1°F Jan 25 |
|
High/Low Humidity |
99% Jan 05 21% Jan 06 |
|
High/Low Dew Point |
85°F Jun 18 14°F Jan 17 |
| High/Low Pressure |
30.778 in Jan 26 29.551 in Mar 15 |
| Highest Wind Gust | 36 mph May 19 |
| Rainfall |
34.03 in YEAR TO DATE 94% of 36 inch annual average 1.97 inches still needed before January 1st to equal South Central Texas annual rainfall average |
This station was approved by NOAA in 2020 to feed data as a non-NOAA provider to the NOAA MADIS database via the Citizens Weather Observer Program. |
| This private weather station is not affiliated with NOAA except as a volunteer non-NOAA WX data provider. The NOAA logo is a registered trademark of the National Oceanic and Atmospheric Administration, used with permission. |
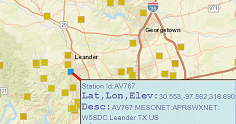
W5SDC-WX in Mason Creek |
316 METERS |
| 30.55295° N 97.86159° W |
01:15 pm  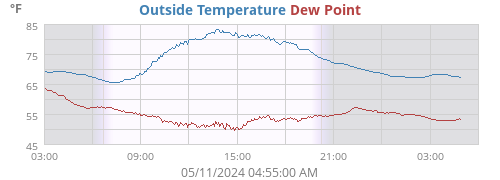 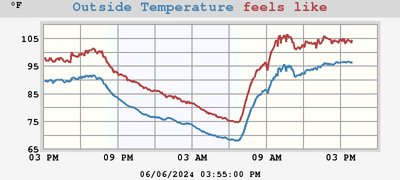   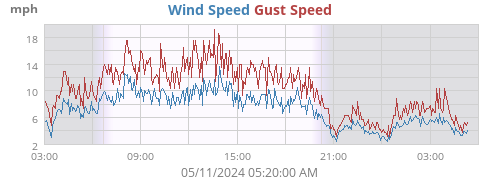 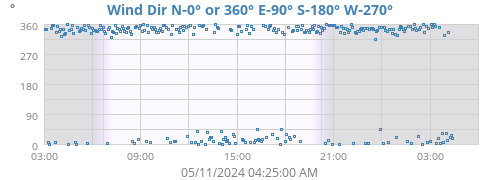 gusting to Light Wind 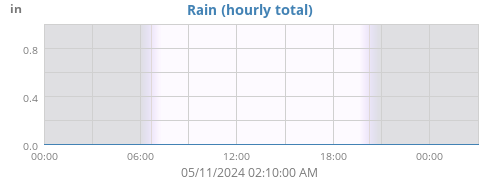 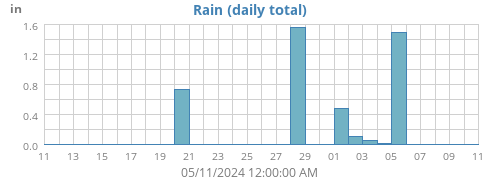 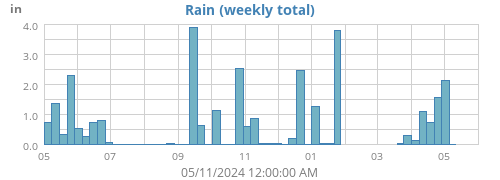 95°F 34°C | feels like 103°F 39°C ⇑ RISING at 1°F per hour S | 185° 4 mph to 7 mph 6 kph to 11 kph 0.00 in | 0.0 mm total rain since midnight
|
   78°F 25°C Server Room High 78°F Low 76°F 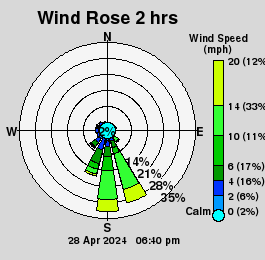 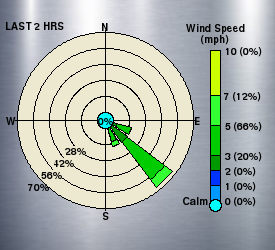
 Outdoor Temperature Trends Outdoor Temperature Trendscompared to current temp of 95°F at 01:15 pm 1°F above 1 hour ago 7°F above 3 hours ago 2°F above 01:15 pm Yesterday 5°F above 01:15 pm 48 hours ago 1°F above 01:15 pm 72 hours ago 2°F above 01:15 pm last Sunday  Rain Totals Rain Totals0.00 in since midnight 0.00 in yesterday 0.00 in this week 4.07 in this month 34.03 in this year  Change ⇓ falling -0.032 in Hg last 3 hours 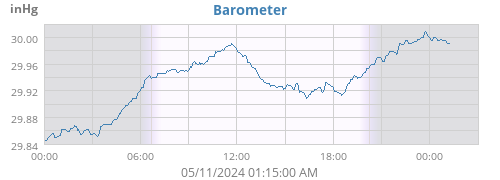 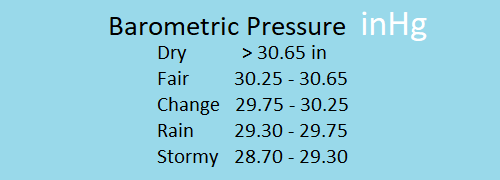 30.012 in Hg 1016 millibars  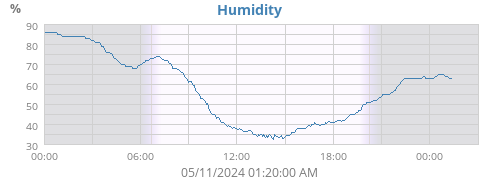 High 98% 06:26 AM Low 52% 01:09 PM -18% change last 3 hrs  75°F 23°C
-2°F change last 3 hours |
   |
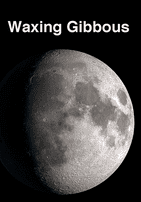
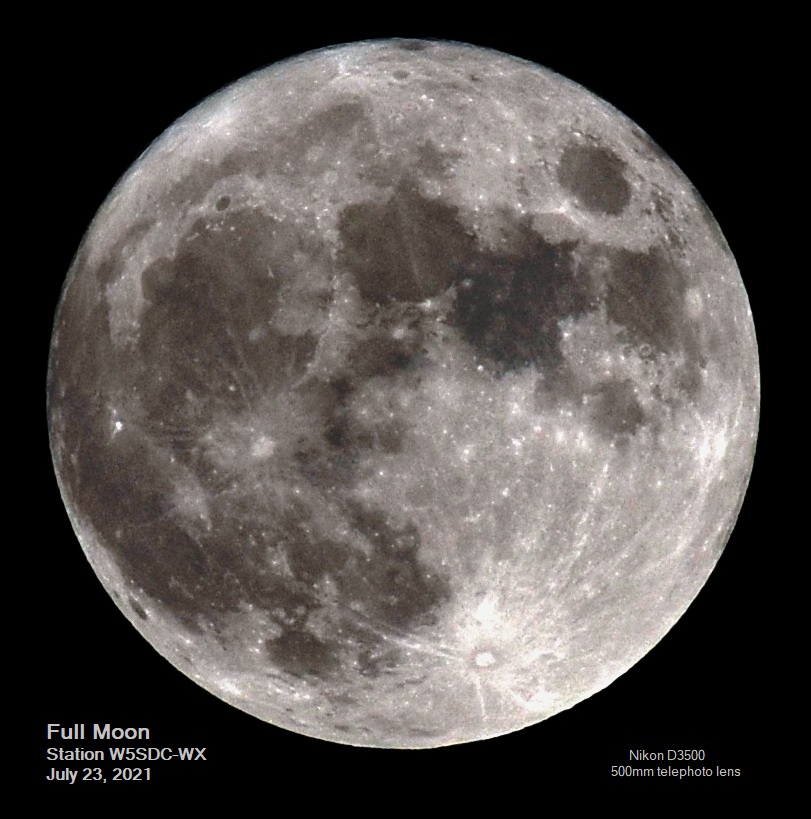
| Moon Phase Northern Hemisphere | |||||||||||||||||
| |||||||||||||||||
 |
94.3972156946 million miles from Earth 77.6101964444° ⇑ above the horizon |
-46 sec less than yesterday |
 |
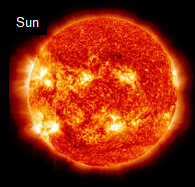
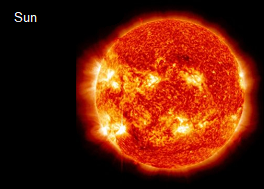 99.86% total mass of the entire solar system. Converts 600 million tons of hydrogen per second into heat and light from nuclear fusion inside it's core. Medium size star. Diameter 864,938 mi Rotation Period 648 hours Year 247.7 billion years Average surface temp 10,000°F 5538°C Current Position and Bearings 94.3972156946 million miles from Earth Rise 06:45:51 AM Set 08:29:48 PM Bearing 153.846691583° 77.6101964444° above the horizon |
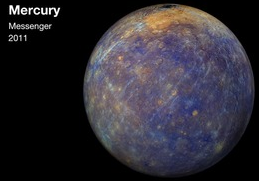 Smallest planet. Closest to the Sun, but not the hottest planet. Shrinking diameter and surface wrinkling due to loss of core temp. No moon. Diameter 3,031.9 mi Day 4222.6 hrs Year 88 days Average surface temp 330°F 166°C Current Position and Bearings 68.2227610103 million miles from Earth 35.7234396138 million miles from the Sun Rise 05:35:49 AM Set 07:13:09 PM Bearing 227.689219077° 73.685808804° above the horizon |
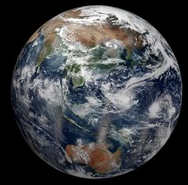
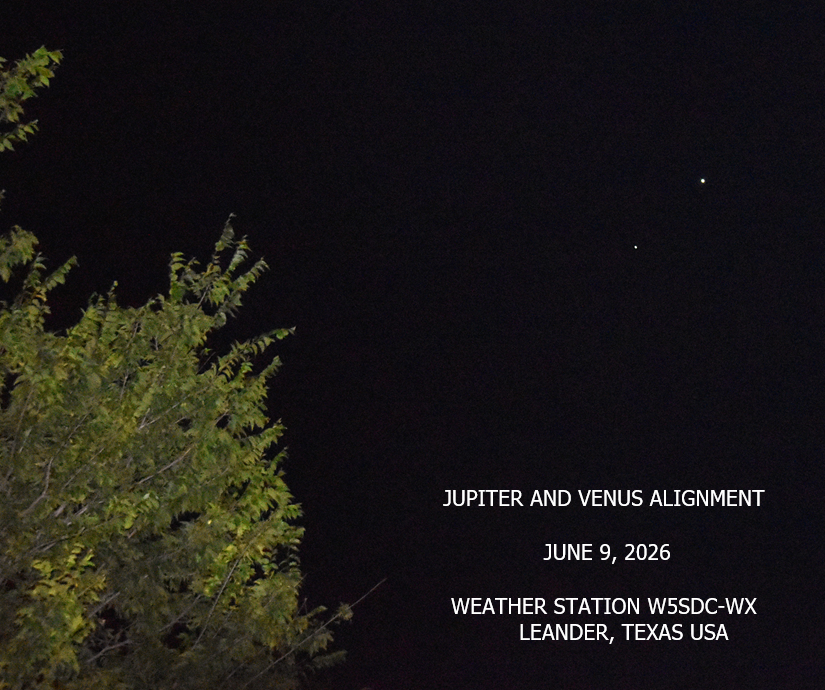
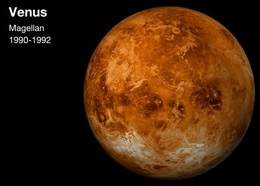 Hottest planet due to high pressure CO2 greenhouse atmosphere. Brightest due to highly reflective clouds of CO2. No moon. Diameter 7,520.8 mi Day 2802 hrs Year 224.7 days Average surface temp 867°F 464°C Current Position and Bearings 78.2711172543 million miles from Earth 67.4427113194 million miles from the Sun Rise 10:18:00 AM Set 10:45:43 PM Bearing 108.774054684° 37.0986608354° above the horizon | 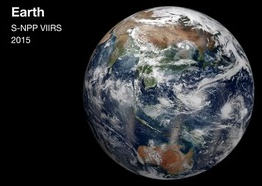 Only planet with H2O oceans, active and extinct life forms, and just one moon. Diameter 7,917.5 mi Day 24 hrs Year 365.25 days Average surface temp 59°F 15°C (rising due to CO2 pollution) Current Position 94.3972156946 million miles from the Sun 255284 mi from the Moon |
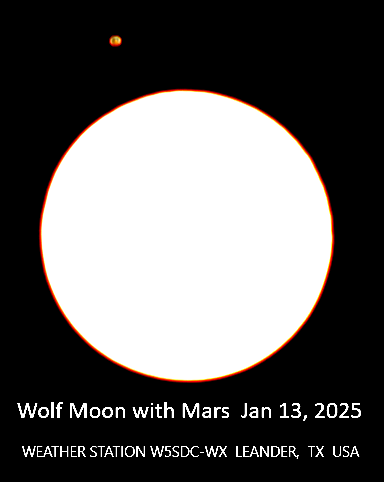
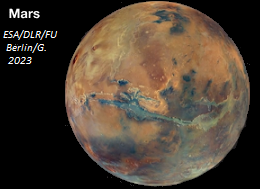 Oxidized ores explain it's reddish tint. Polar ice caps, a rocky core, and four seasons like Earth. 2 moons Diameter 4,212.3 mi Day 24h 37m 23s Year: 687 days Average surface temp -85°F -65°C Current Position and Bearings 187.626983096 million miles from Earth 136.927254842 million miles from the Sun Rise 03:27:32 AM Set 05:28:45 PM Bearing 268.894138415° 52.2114925629° above the horizon |
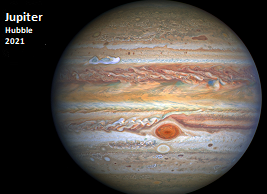 Largest planet, all gases, no land surface, and a dilute core. Violent hydrogen & helium atmosphere. Storms last for centuries. 95 moons Diameter 86,881 mi Day 09h 50m 30s Year 11.86 years Average surface temp -166°F -110°C Current Position and Bearings 585.591726926 million miles from Earth 491.268411726 million miles from the Sun Rise 06:57:13 AM Set 08:36:09 PM Bearing 145.640997936° 76.6293129777° above the horizon |
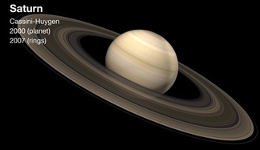 Saturn's strong gravity is devouring her rings at 11 tons per second. 146 confirmed moons. All gases, no land surface. 2nd largest planet. Diameter 72,367 mi Day 10h 14m Year 29.46 years Average surface temp -220°F -140°C Current Position and Bearings 0.843581466008 billion mi from Earth 0.878886332846 billion miles from the Sun Rise 12:03:13 AM Set 12:22:42 PM Bearing 281.233312283° -11.707126945° above the horizon |
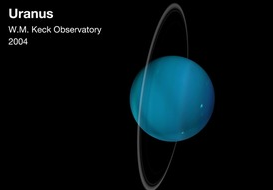 28° axial tilt, similar to Mars & Earth Rotates on it's side. 27 moons. No land surface. 3rd largest planet Diameter 31,518 mi Day: 17h 14m Year: 84 years Average surface temp -320°F -196°C Current Position and Bearings 1.85516697915 billion miles from Earth 1.80829352129 billion miles from the Sun Rise 02:32:01 AM Set 04:19:42 PM Bearing 273.804634617° 37.9426775565° above the horizon |
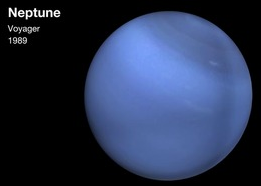 Furthest, darkest, coldest, and smallest outer planet. 1,500 mph winds and 14 moons. No land surface. 4th largest planet. Diameter 30,599 mi Day 16 hrs Year 164.8 years Average surface temp -330°F -201°C Current Position and Bearings 2.72983944354 billion miles from Earth 2.77748255693 billion miles from the Sun Rise 11:26:30 PM Set 11:35:26 AM Bearing 284.22171129° -21.7939229905° above the horizon |

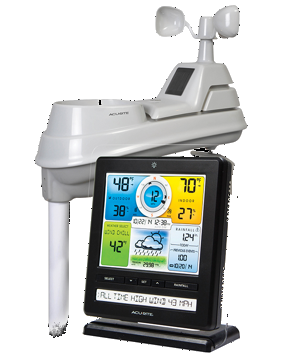
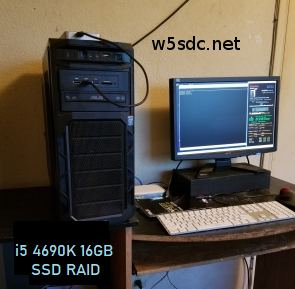
| Steve Storm chaser, weather station technician, and internet domain linux admin This station's first weather page went live on the internet in January of 2004. Since then, home weather stations have become much more reliable, affordable, and now provide much more data than just basic temperature, wind, and rain measurements.
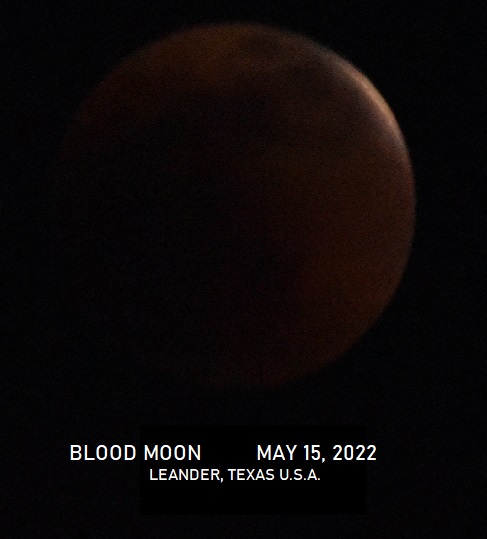
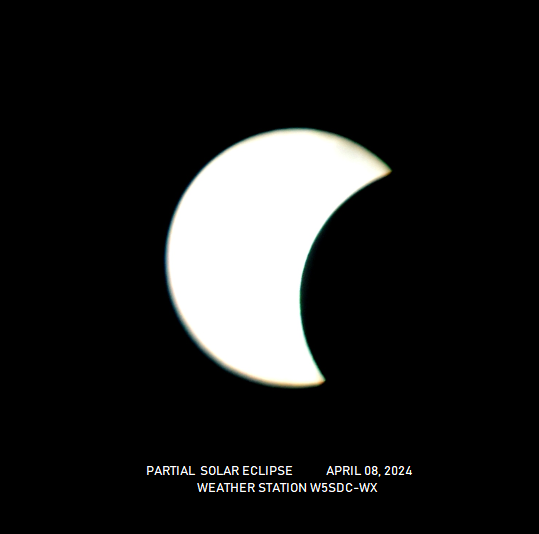
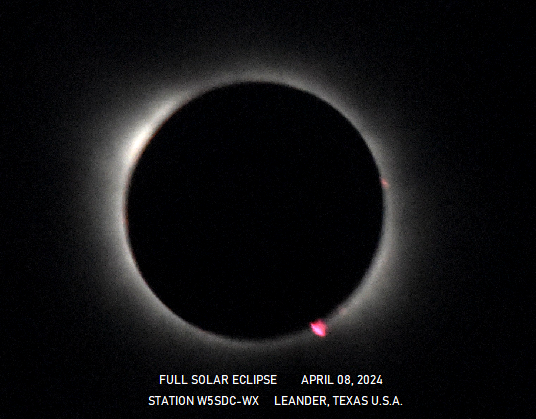
   Big thanks to Tom Keffer for writing the weeWX weather station engine and also to Matthew Wall and Gary Roderick for their invaluable contributions to weeWX, it's drivers, and it's extensions. Get the whole saga of weeWX and the software at the link above. weeWX is relatively easy to configure and use even for those like me with limited programming experience. On June 26, 2017, I started with the basic HTML template that was included with weeWX and have watched this entire weather website's template grow to 1.972 lines of HTML over the last eight years. Elwood Downey RIP since Jan 29, 2026 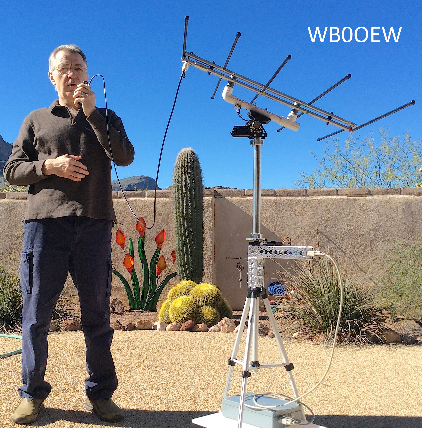 The astronomical position calculations used in the Heavenly Bodies section of this website were written by Mr. Downey. The last time that I heard from Elwood was in April
of 2024 when we exchanged photos of the full solor eclipse on April 8th. Both his friendly attitude and his ingenious abilities will be sorely missed.
|


 Last Rain Event